What are private market benchmarks and why do they matter?
July 30, 2021For the purposes of benchmarking the performance of publicly traded stock, many people are familiar with how public indexes—like the S&P 500 and Dow Jones Industrial Average—are leveraged. However, the concept and practice of benchmarking private market funds may be more opaque.
To see what strategic benchmarking involves, dive into our list of frequently asked questions below. If you have questions about competitive benchmarking or using benchmarks as a primary performance metric, leave us a comment. We’ll try to answer it in a future update of this blog post.
Private market benchmarks FAQ
What are private market benchmarks?
Private market benchmarks are standards against which investors and other private market professionals can compare the returns of a fund to the returns of its peers. Evaluating benchmarks allows investors to see how their funds stack up, identify performance gaps and take steps to improve performance when necessary. In PE and VC, fund performance is benchmarked against a set of peer funds with similar attributes—we dig deeper into those attributes below.
What is the function of benchmarking for private market funds?
Benchmarking provides a way for limited partners (LPs) and general partners (GPs) to gauge the performance of an individual fund in relation to its peers, and evaluate broader performance across asset classes.
Why does performance benchmarking matter in the private markets?
Using robust benchmarks, LPs can be confident that they won’t miss any important investment opportunities or make any less-than-stellar allocation decisions. For GPs on the other hand, access to benchmarks means their fundraising efforts will be significantly easier.
How is evaluating the performance of public and private market funds different?
Private market funds are based on different strategies and are structured for entirely different return profiles compared to public market funds. Because of that, they face a distinct set of challenges, and it’s especially important to consider alternative metrics when evaluating their performance. Private market funds require benchmarks that take into account things like longer time horizons, extended lock-up periods and less liquid fund structures.
What fund attributes make up a standard private market benchmark?
In addition to fund size, vintage and geography, private market benchmarks typically show peer groups based on fund type, including:- VC benchmarks
- PE benchmarks
- Real assets benchmarks
- Private debt benchmarks
What is fund size and why does fund size matter?
Fund size is important to control for because it will impact portfolio construction as well as the size and timing of cash flows. Funds of varying sizes may behave in different ways. Another factor to consider is that larger funds may have an outsized effect on an overall set of benchmarks if funds were not grouped together.
What does vintage mean in the context of a fund?
At PitchBook, we consider a fund’s vintage to be the year it makes its first capital call. Funds are grouped by vintage to control for time. For example, funds that share the same time frame will have been exposed to similar economic conditions, which helps make for a more accurate comparison.
What is fund type and why does it matter?
Fund type refers to strategy, such as VC, PE, real assets, debt and secondaries. It’s important to consider fund type, as different strategies will employ different approaches to portfolio construction and make investments in significantly different targets (which will also have varying risk/return profiles).
For example, a VC fund will invest in relatively newer, up-and-coming companies (such as Lime) while a PE fund will invest in larger, more established companies (such as Staples). Further, a VC fund may be more likely to invest in a wider number of portfolio companies and call down capital more frequently.
Fund type can be further broken out to include more specific classifications within asset classes. Here is a table showing some fund types that PitchBook tracks. Though we don't signify additional classifications for fund of funds or secondaries, we still measure them as distinct groups.
| Private equity |
|
| Venture capital |
|
| Real assets |
|
| Private debt |
|
*The PitchBook Benchmark report series does not currently include specific venture capital classifications, while the platform does track them.
What is the internal rate of return (IRR)?
Internal rate of return is a go-to metric used in the private market community to measure a fund’s overall performance.
An IRR benchmark is especially useful for private market funds as it includes the timing of cash flows, such as when capital is called down or deployed. The efficient use of uninvested capital (as well as invested capital) can significantly impact overall returns and is important to track, particularly considering a closed-end fund structure. The technical definition is that it represents the rate at which an historical series of cash flows are discounted so that the net present value of the cash flows equals zero.
Here’s what the formula looks like: Where: CF0 = Initial Investment / Outlay CF1, Cf2, CF3, .... CFn = Cash flows N = Holding period NPV = Net Present Value IRR = Internal Rate of Return |
What is horizon IRR?
Horizon IRR is a metric that shows the IRR for a specific range of time. For example, a 1-year Horizon IRR will look at IRR over the period of one year, a 3-year Horizon IRR will look at three years and so on. This is helpful to measure as it can highlight differences in performance across funds’ lifecycles.
What is public market equivalent (PME)?
Public market equivalent is a calculation used to compare private market fund performance to a given public index. This metric accounts for irregular cash flows by calculating equivalent investments in a public market benchmark using the timing of a private market fund’s capital calls and distributions. It’s designed to give investors more of an apples-to-apples comparison between private market funds and public benchmarks.
Quick tip: Don’t confuse PME with public or private comparables, which are used to assess the value of a company.
What are cash multiples (DPI, RVPI, TVPI)?
Cash multiples provide a relatively easy way to gauge the scale of a given fund’s returns. Each multiple compares an aspect of a fund’s value to capital that’s already been called down or “paid-in.” For example, these multiples include capital that is distributed back to LPs (DPI), the remaining unrealized value of a fund (RVPI) and the overall realized and unrealized value of a fund (TVPI).
What is DPI?
DPI stands for Distributions to Paid-In and represents how much value has been returned to LPs relative to how much capital has been called by a GP. Also called the realization or cash-on-cash multiple, this measure is helpful for seeing how much a fund is paying out. Generally, higher DPI is preferable as it shows that a GP is able to return more capital (e.g. a 2.0x DPI means that two times the amount has been returned compared to the amount paid-in).
What is RVPI?
RVPI stands for Remaining Value to Paid-In and represents how much unrealized value remains in a fund relative to what’s been paid-in. This multiple can help track a fund’s market value through the net asset value of unrealized assets. As a fund ages and investments are exited, RVPI will continue to decrease towards zero.
What is TVPI?
TVPI stands for Total Value to Paid-In and represents the combined realized (DPI) and unrealized (RVPI) value of a fund relative to paid-in capital. As the name suggests, it shows the overall value of a fund compared to its cost (a higher TVPI would indicate higher value).
What is a hurdle rate?
A hurdle rate is the rate of return (above return of capital) that a GP must return to its LPs before taking any profit. It is measured as a percentage.
What additional benefits do PitchBook clients get from PitchBook Benchmarks?
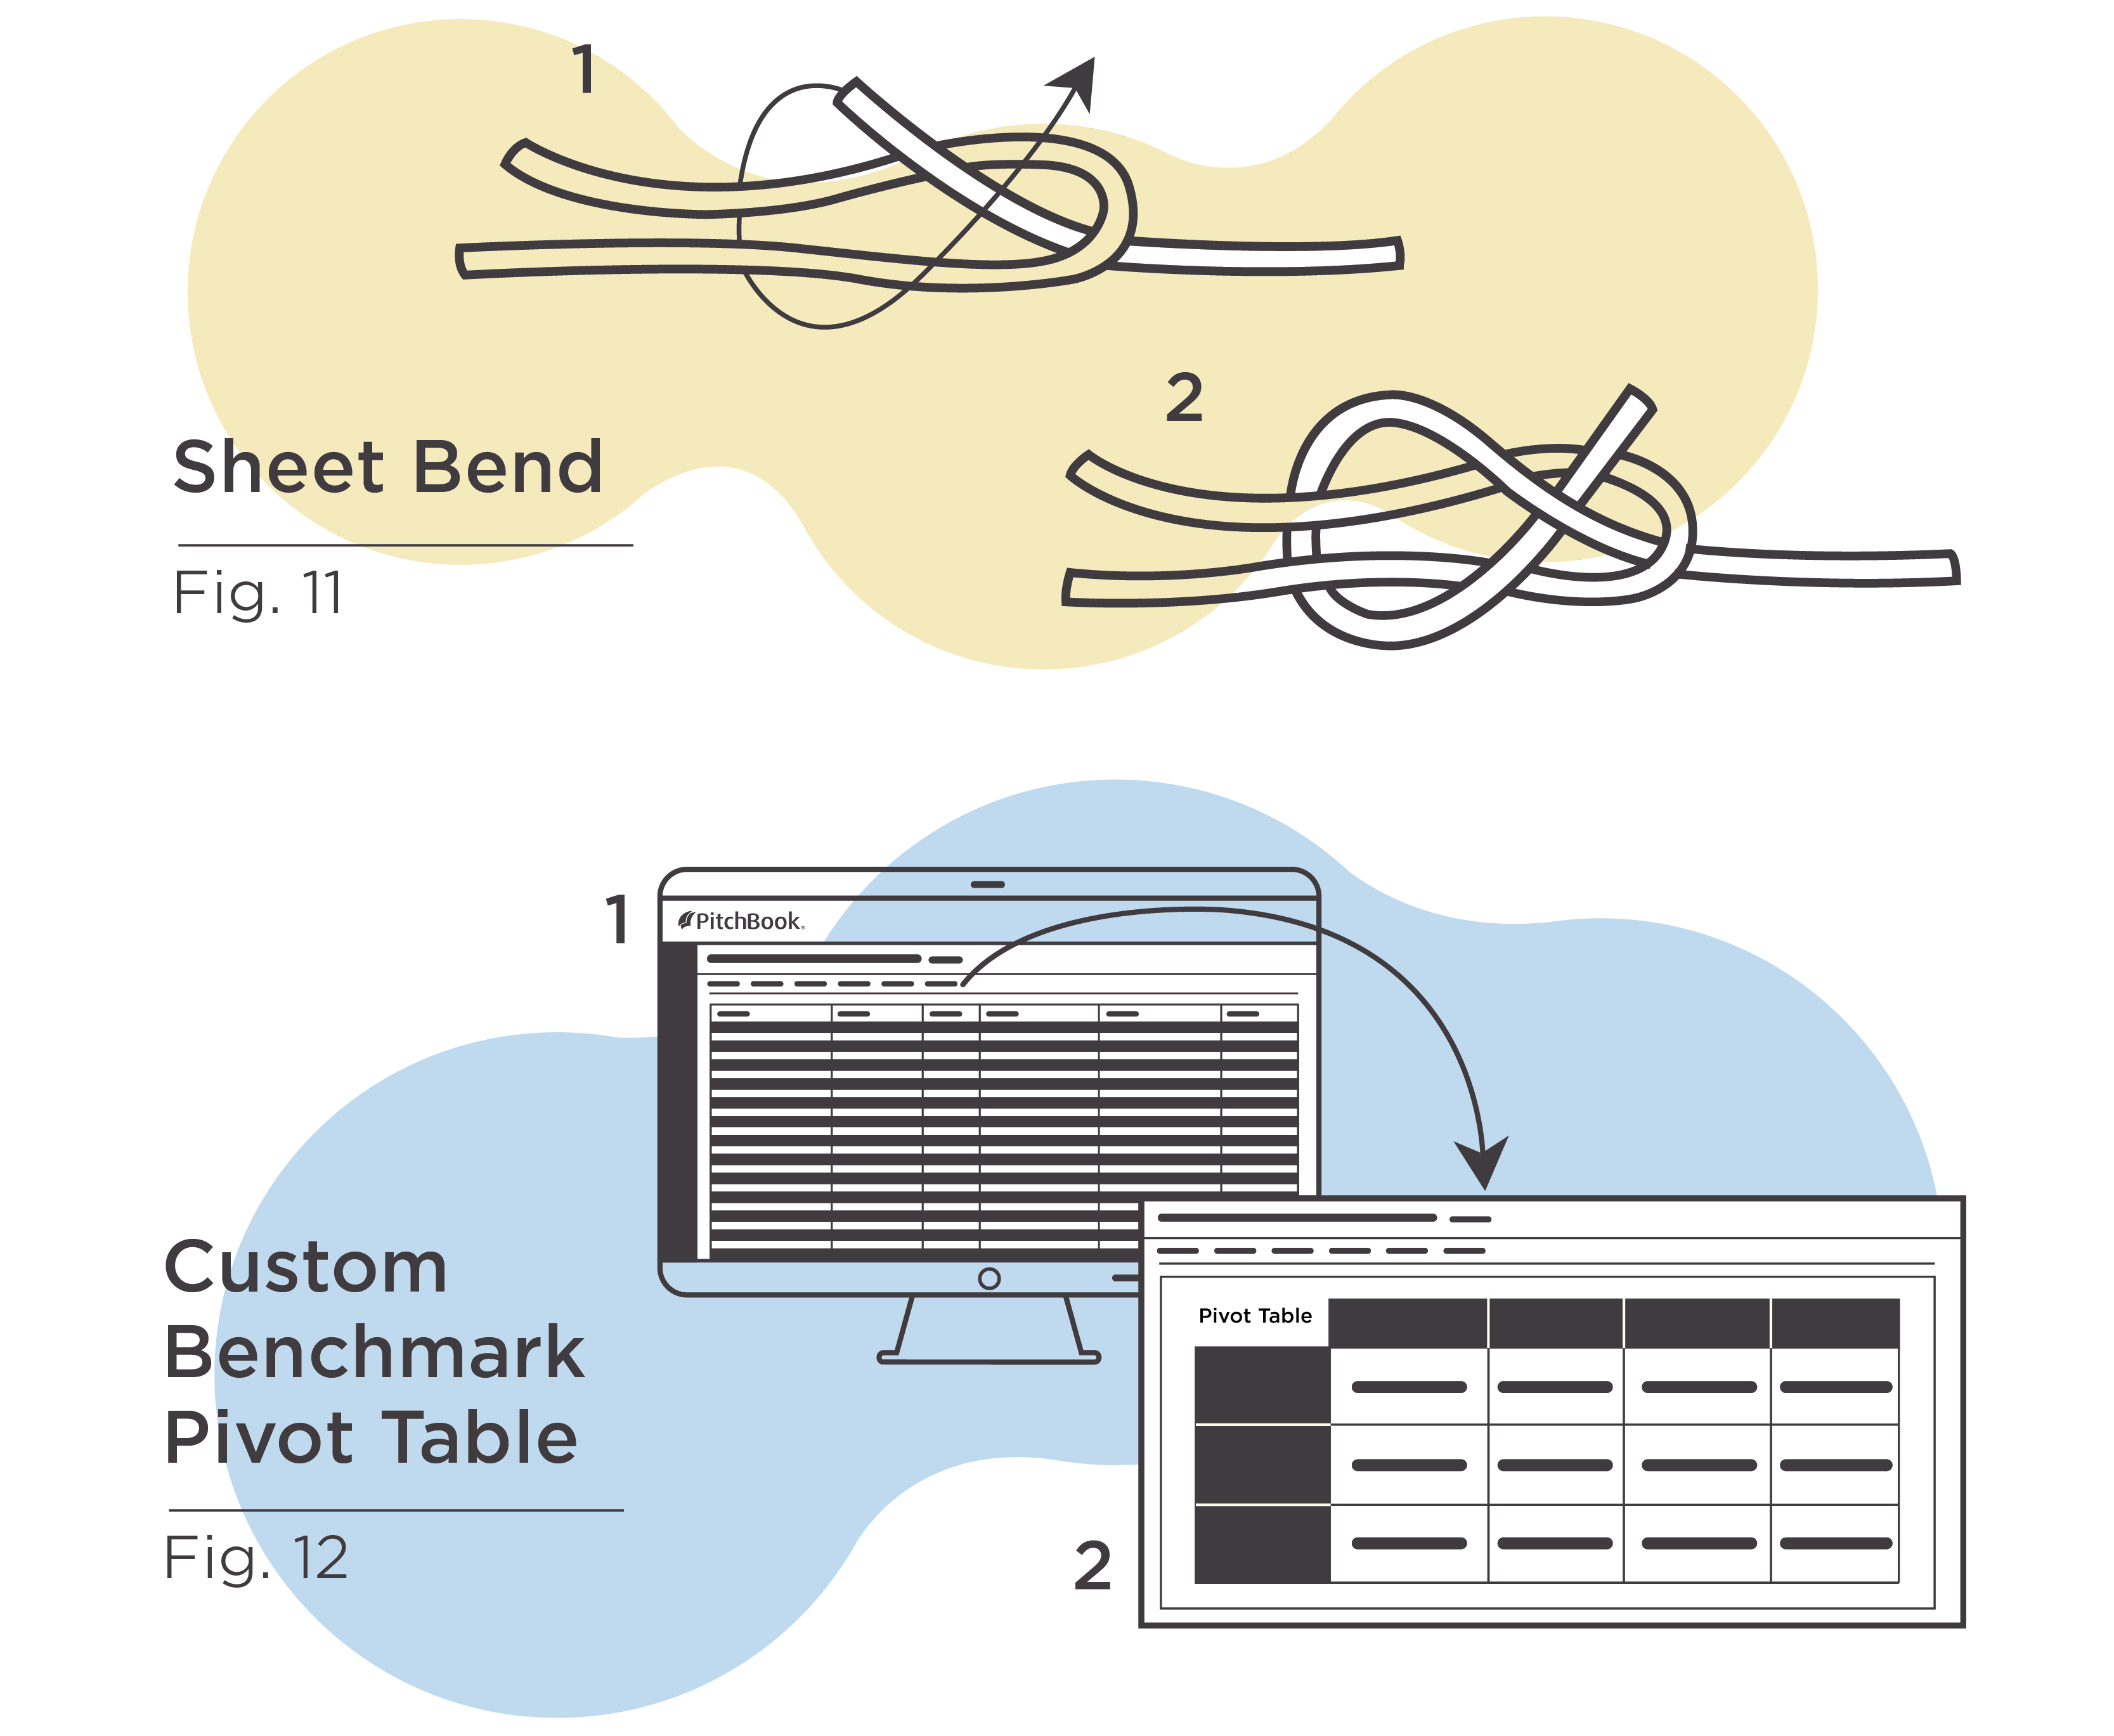
PitchBook clients get full transparency into the underlying funds that make up each benchmark, all of those individual funds' return histories and even the investments made by those funds. Plus, PitchBook also provides built-in pivot tables that allow users to easily identify hurdle rates for peer groups.
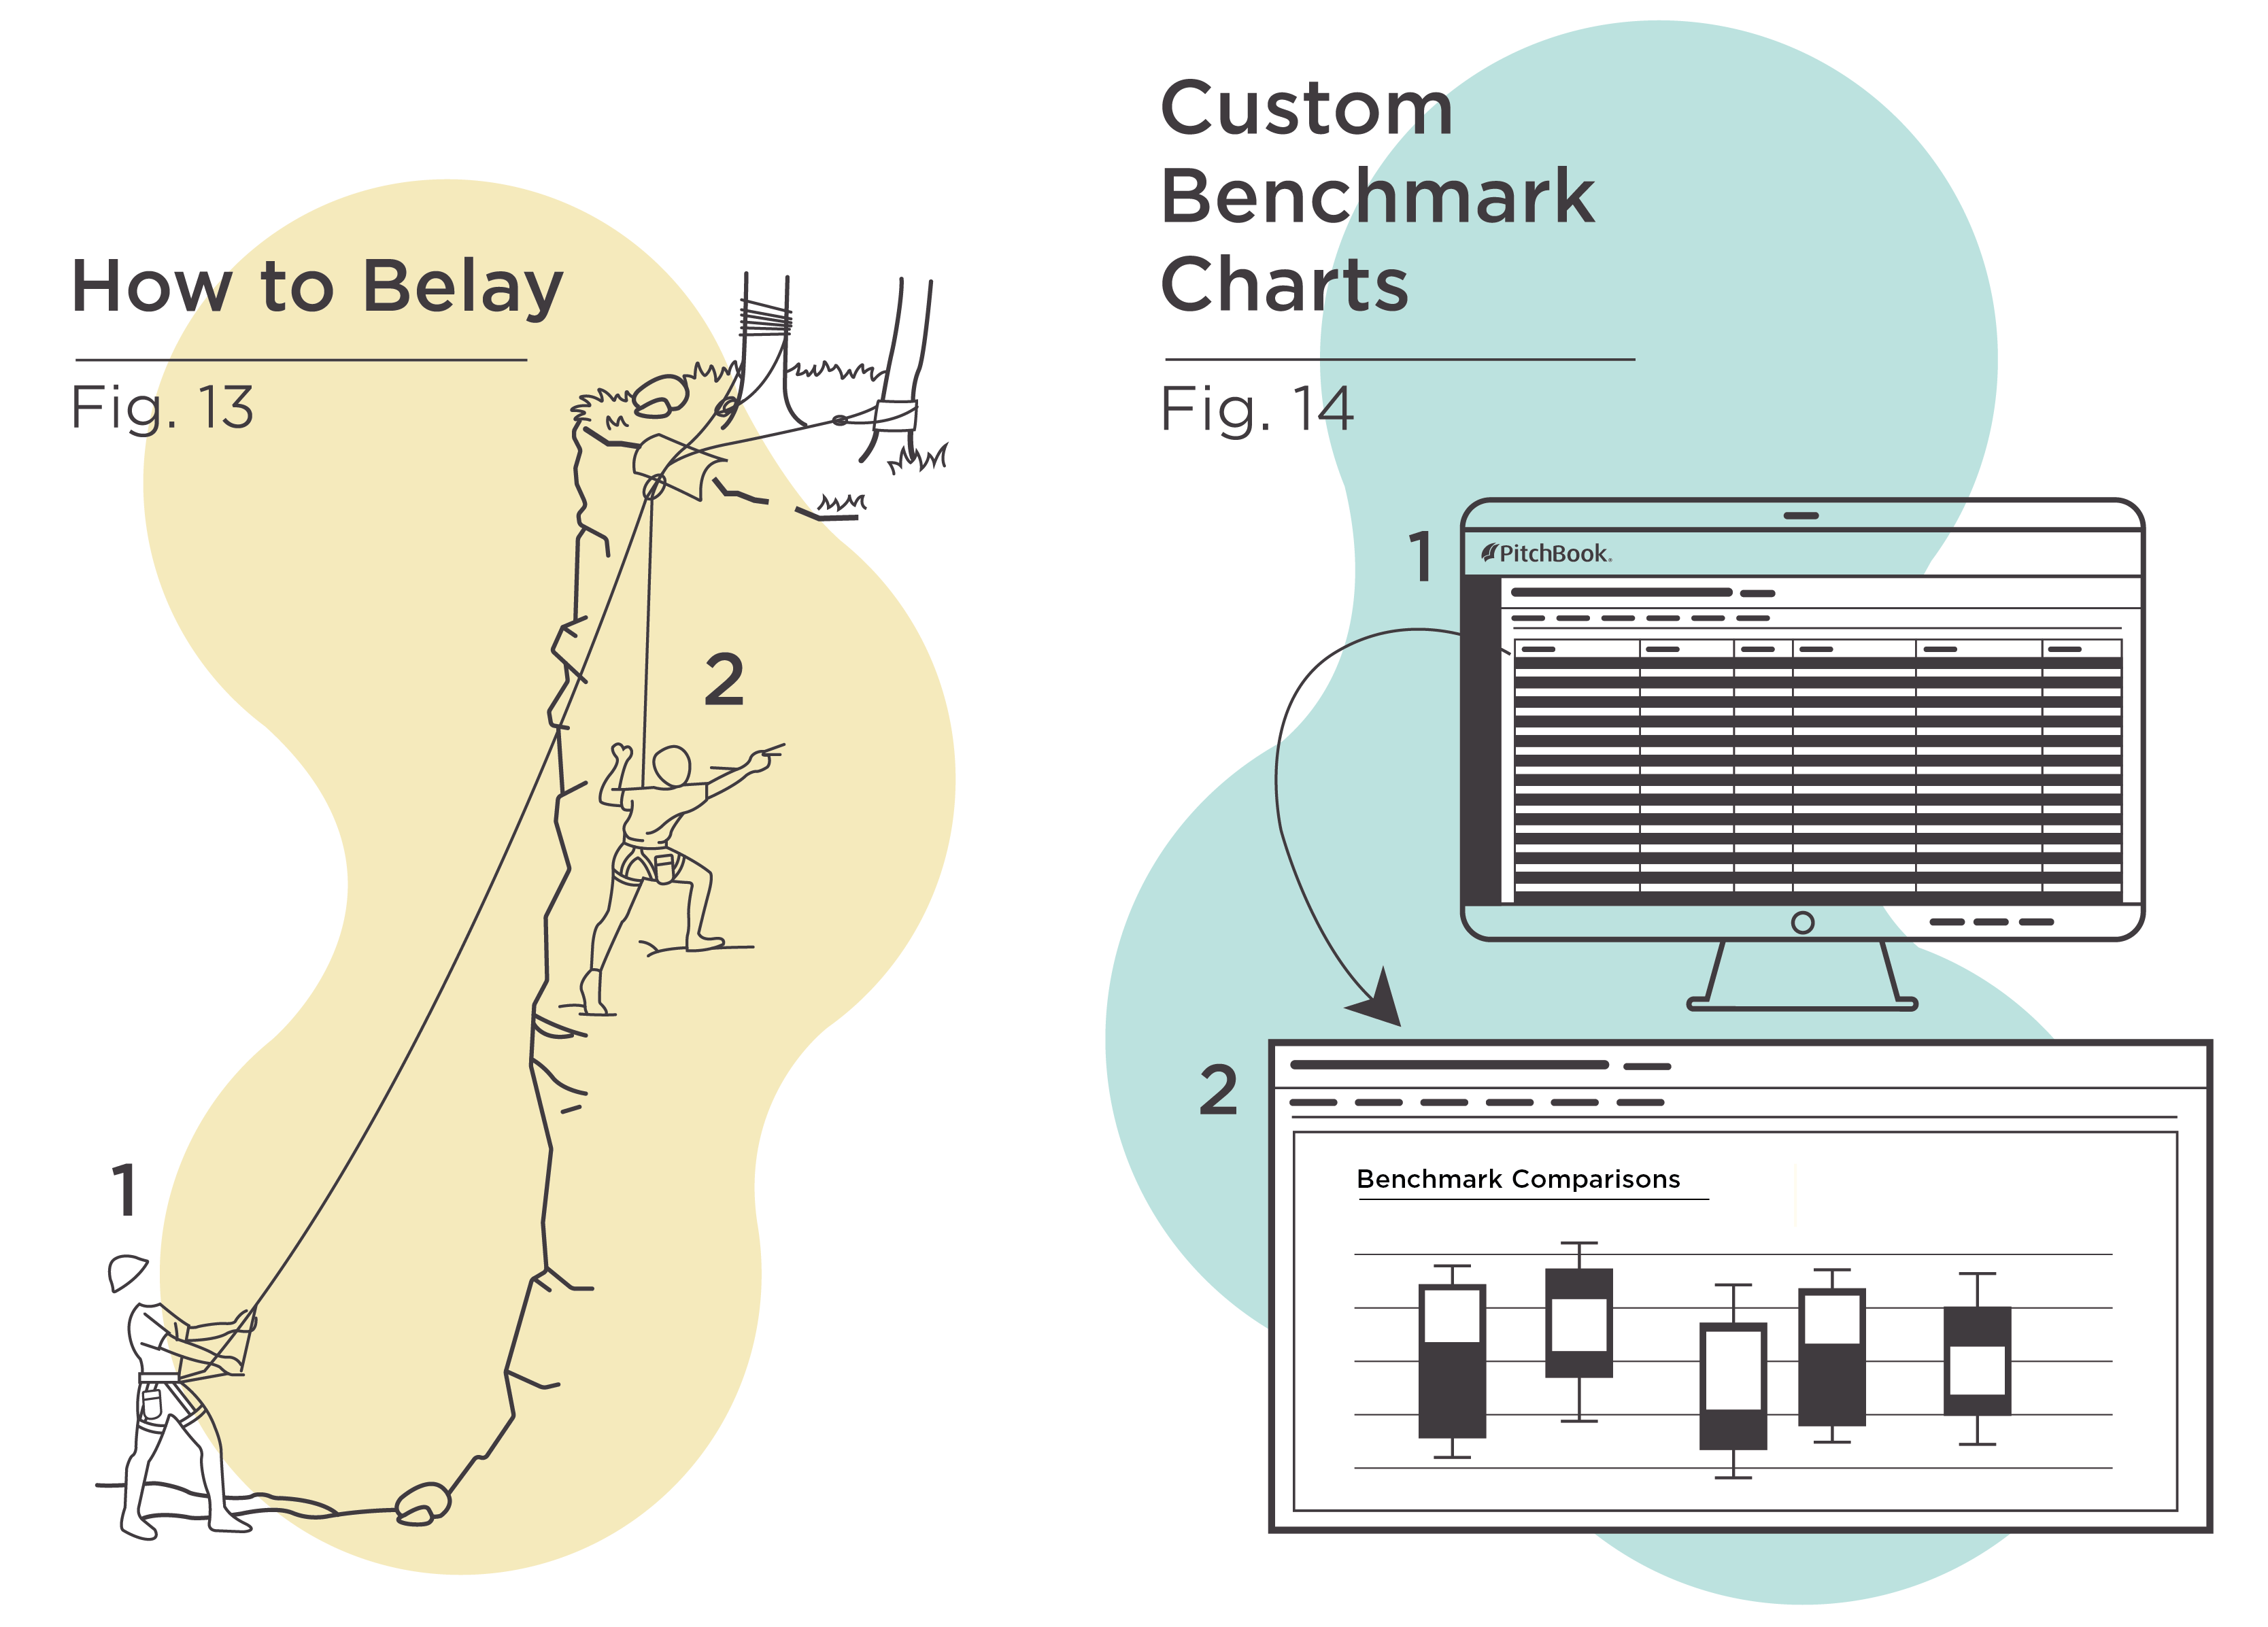
In addition to access to the PitchBook Benchmarks report series, the PitchBook Platform offers clients the ability to create benchmarks with custom peer groups based on criteria of their choice (including portfolio construction and industry).
Why would it help to consider the underlying investments a fund has made?
Investors need insight into the underlying data used to construct a benchmark to determine if it fits their needs or if a more tailored approach is needed for an appropriate comparison.
More about private market benchmarking
See what’s really driving fund returns with PitchBook’s Custom Benchmarks
Check out this blog post about how you can tailor benchmarks to specific peer groups, strategies or geographies to better compare performance across funds using our Custom Benchmarks feature
Get a better sense of fund performance relative to broader asset classes and other private market strategies
Download our most recent PitchBook Benchmarks report
Learn how to make smarter allocations with better benchmarks
Watch our video on PitchBook for benchmarking and asset allocation
Comments:
Thanks for commenting
Our team will review your remarks prior to publishing.
Please check back soon to see them live.