
GSC Group was an institutional investment manager of alternative assets with a full spectrum of complementary investment product offerings, significantly increased assets under management and a roster of investors. It specialized in credit-driven investing including control distressed debt, corporate credit, European mezzanine lending and structured finance. The firm filed for Chapter 11 bankruptcy on August 31, 2010.
| Company Name | Deal Date | Deal Type | Deal Size | Industry | Company Stage | Lead Partner |
|---|---|---|---|---|---|---|
| 000000000 00000 00 | 30-Aug-2016 | 0000000000 | Industrial Supplies and Parts | Generating Revenue | ||
| 00000000000 000000 | 16-May-2013 | 0000000000 | Asset Management | Generating Revenue | ||
| 00000000 | 13-Apr-2011 | 0000000000 | Industrial Supplies and Parts | Generating Revenue | ||
| 000000 | 13-Apr-2011 | 0000000000 | Industrial Supplies and Parts | Generating Revenue | ||
| Grupo Proeza (NovoCast and Teknik Foundries) | 12-Apr-2011 | Buyout/LBO | Iron and Steel Mining | Profitable |
| Company Name | Exit Date | Exit Type | Exit Size |
|---|---|---|---|
| 0000 000000 00000 | 18-Sep-2017 | 0000000000 | |
| 0000000000 00000 | 31-May-2015 | 000000000000000000 | 00000 |
| 00000 0000 | 04-Feb-2015 | 000 | 00000 |
| 000000000 | 23-Sep-2014 | 000000000000000000 | 00000 |
| Grede Holdings | 28-Aug-2014 | Buyout/LBO | 00000 |
| Fund Name | Vintage | Size | Dry Powder | DPI | RVPI | TVPI | IRR |
|---|
This information is available in the PitchBook Platform. To explore GSC Group‘s full profile, request access.
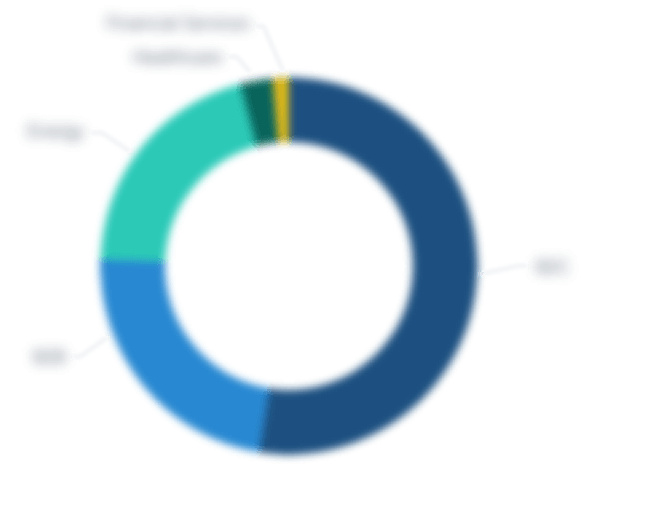
Request a free trialInvestments by Industry
Investments by Year

Investments by Region

PitchBook’s data visualizations quickly surface an investor’s historical investments—showing a breakdown of activity by industry, year and region.
Request a free trial